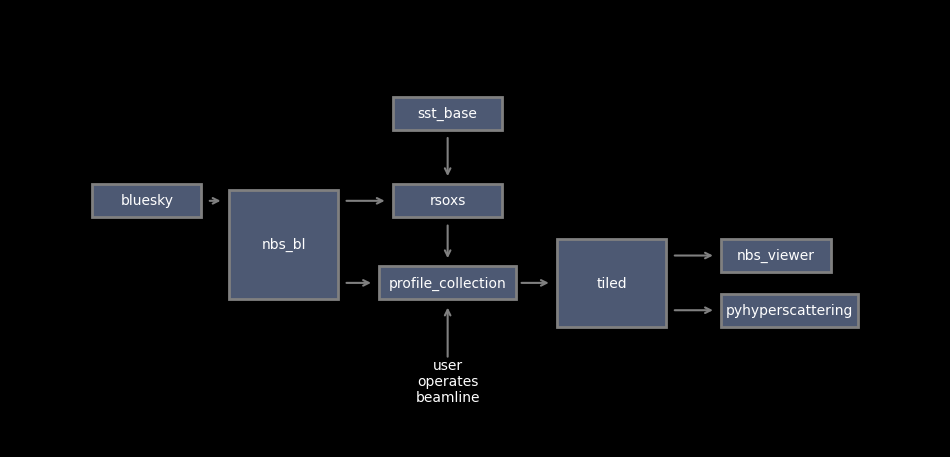
```{python}
#| code-fold: true
import matplotlib.pyplot as plt
import matplotlib.patches as patches

## Set global style to dark
plt.style.use('dark_background')

## Create the figure and axis objects
fig, ax = plt.subplots(figsize=(12, 8))

## Color constants
edge_col = (0.5, 0.5, 0.5, 1)
face_col = (0.3, 0.35, 0.45, 1)
text_col = 'white'

## --- SST_BASE ---
sst_base = patches.Rectangle(
    xy = (0, 1.8),
    width = 2,
    height = 0.6,
    linewidth = 2,
    edgecolor = edge_col,
    facecolor = face_col,
    )
ax.add_patch(p=sst_base)
ax.text(x=1, y=2.1, s="sst_base", color=text_col, ha="center", va="center")

## --- BLUESKY ---
bluesky = patches.Rectangle(
    xy = (-5.5, 0.2),
    width = 2,
    height = 0.6,
    linewidth = 2,
    edgecolor = edge_col,
    facecolor = face_col,
    )
ax.add_patch(p=bluesky)
ax.text(x=-4.5, y=0.5, s="bluesky", color=text_col, ha="center", va="center")

## --- NBS_BL ---
nbs_bl = patches.Rectangle(
    xy = (-3, -1.3),
    width = 2,
    height = 2,
    linewidth = 2,
    edgecolor = edge_col,
    facecolor = face_col,
    )
ax.add_patch(p=nbs_bl)
ax.text(x=-2, y=-0.3, s="nbs_bl", color=text_col, ha="center", va="center")

## --- RSOXS ---
rsoxs = patches.Rectangle(
    xy = (0, 0.2),
    width = 2,
    height = 0.6,
    linewidth = 2,
    edgecolor = edge_col,
    facecolor = face_col,
    )
ax.add_patch(p=rsoxs)
ax.text(x=1, y=0.5, s="rsoxs", color=text_col, ha="center", va="center")

## --- PROFILE COLLECTION ---
profile_collection = patches.Rectangle(
    xy = (-0.25, -1.3),
    width = 2.5,
    height = 0.6,
    linewidth = 2,
    edgecolor = edge_col,
    facecolor = face_col,
    )
ax.add_patch(p=profile_collection)
ax.text(x=1, y=-1.0, s="profile_collection", color=text_col, ha="center", va="center")

## --- TILED ---
tiled = patches.Rectangle(
    xy = (3, -1.8),
    width = 2,
    height = 1.6,
    linewidth = 2,
    edgecolor = edge_col,
    facecolor = face_col,
    )
ax.add_patch(p=tiled)
ax.text(x=4, y=-1.0, s="tiled", color=text_col, ha="center", va="center")

## --- NBS_VIEWER ---
nbs_viewer = patches.Rectangle(
    xy = (6, -0.8),
    width = 2,
    height = 0.6,
    linewidth = 2,
    edgecolor = edge_col,
    facecolor = face_col,
    )
ax.add_patch(p=nbs_viewer)
ax.text(x=7, y=-0.5, s="nbs_viewer", color=text_col, ha="center", va="center")

## --- PYHYPERSCATTERING ---
pyhyperscattering = patches.Rectangle(
    xy = (6, -1.8),
    width = 2.5,
    height = 0.6,
    linewidth = 2,
    edgecolor = edge_col,
    facecolor = face_col,
    )
ax.add_patch(p=pyhyperscattering)
ax.text(x=7.25, y=-1.5, s="pyhyperscattering", color=text_col, ha="center", va="center")

## --- ARROWS (Straight Logic) ---

## sst_base --> rsoxs (Straight Down)
ax.annotate(text="", xy=(1, 0.9), xytext=(1, 1.7), arrowprops=dict(arrowstyle='->', lw=1.5, color='gray'))

## bluesky --> nbs_bl (Straight Right)
ax.annotate(text="", xy=(-3.1, 0.5), xytext=(-3.4, 0.5), arrowprops=dict(arrowstyle='->', lw=1.5, color='gray'))

## nbs_bl --> rsoxs (Straight Right)
ax.annotate(text="", xy=(-0.1, 0.5), xytext=(-0.9, 0.5), arrowprops=dict(arrowstyle='->', lw=1.5, color='gray'))

## nbs_bl --> profile_collection (Straight Right)
ax.annotate(text="", xy=(-0.35, -1.0), xytext=(-0.9, -1.0), arrowprops=dict(arrowstyle='->', lw=1.5, color='gray'))

## rsoxs --> profile collection (Straight Down)
ax.annotate(text="", xy=(1, -0.6), xytext=(1, 0.1), arrowprops=dict(arrowstyle='->', lw=1.5, color='gray'))

## profile_collection --> tiled (Straight Right)
ax.annotate(text="", xy=(2.9, -1.0), xytext=(2.3, -1.0), arrowprops=dict(arrowstyle='->', lw=1.5, color='gray'))

## [MODIFICATION] Branching straight arrows from tiled
## tiled --> nbs_viewer (Straight Right at y=-0.5)
ax.annotate(text="", xy=(5.9, -0.5), xytext=(5.1, -0.5), arrowprops=dict(arrowstyle='->', lw=1.5, color='gray'))

## tiled --> pyhyperscattering (Straight Right at y=-1.5)
ax.annotate(text="", xy=(5.9, -1.5), xytext=(5.1, -1.5), arrowprops=dict(arrowstyle='->', lw=1.5, color='gray'))

## user --> profile_collection (Straight Up)
ax.text(x=1, y=-2.8, s="user\noperates\nbeamline", color=text_col, ha="center", va="center")
ax.annotate(text="", xy=(1, -1.4), xytext=(1, -2.4), arrowprops=dict(arrowstyle='->', lw=1.5, color='gray'))

## Set coordinate limits and hide axes
ax.set_xlim(left=-7, right=10)
ax.set_ylim(bottom=-4, top=4)
ax.set_aspect(aspect='equal')
ax.axis('off')

plt.show()
```