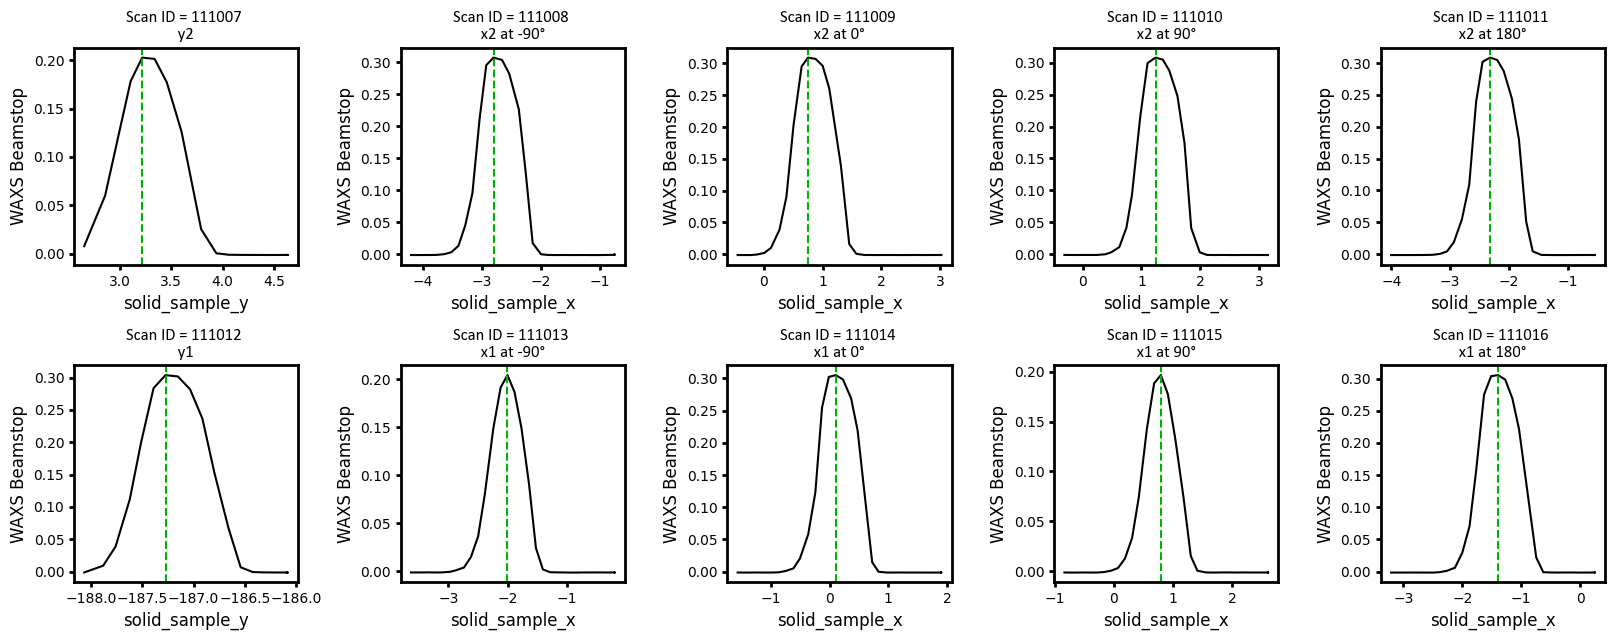
```{python}
#| code-fold: true
def view_fiducial_scans(
    scan_id_start,
    maxima = np.full(10, np.nan),
    photodiode = "WAXS Beamstop",
):
    """
    View fiducial scans and optionally the calculated peak maxima.

    Args:
        scan_id_start: int
            Scan ID for the first fiducial scan in the scan series.
        maxima: list of 10 float values
            Optional list of peak maxima found by Bluesky that can be overlaid onto the fiducial scan plots.
            If no list is provided, default is a list of nan, which does not show up on the plot.

    Returns:
        Plots of each fiducial scan.

    Raises:

    Examples:
    """

    x_lookup = [
                "solid_sample_y",
                "solid_sample_x",
                "RSoXS Sample Up-Down",
                "RSoXS Sample Outboard-Inboard",
    ]
    y_lookup = [
                "DM7 photodiode",
                #"WAXS Beamstop",
                #"SAXS Beamstop",
    ]
    ## TODO: come up with more robust way to handle this
    y_lookup = [photodiode]

    subplot_title_labels = np.array([" \n y2 ", " \n x2 at -90° ", " \n x2 at 0° ", " \n x2 at 90° ", " \n x2 at 180° ",
                               " \n y1 ", " \n x1 at -90° ", " \n x1 at 0° ", " \n x1 at 90° ", " \n x1 at 180° "])

    ## Make figure
    number_rows, number_columns = 2, 5
    fig, axs = plt.subplots(number_rows, number_columns, figsize=(number_columns*3.25, number_rows*3.25), edgecolor=(0, 0, 0, 0), linewidth=3); #figsize=(3.25, 3.25) for figure
    #fig.suptitle((""), color=(0, 0, 0, 1), fontname="Calibri", size=24)
    ## Enxure axs always stays a 2D array
    if number_rows == 1 and number_columns == 1: axs = np.array([[axs]])
    if number_rows == 1 and number_columns > 1: axs = axs.reshape(1, number_columns)
    if number_rows > 1 and number_columns == 1: axs = axs.reshape(number_rows, 1)

    ## Fiducial scan series has 10 scans
    scan_ids = np.arange(scan_id_start, (scan_id_start + 10), 1)
    for index_scan_id, scan_id in enumerate(scan_ids):
        ## Load scan.  If the scan does not exist yet, stop the loop.
        try: scan_raw = catalog[int(scan_id)]
        except: break

        ## Gather x and y data
        data_variable_names = list(scan_raw["primary"]["data"].read().data_vars.keys())
        x_axis_name, y_axis_name = "", ""
        for data_variable_name in data_variable_names:
            if data_variable_name in x_lookup:
                x_axis_name = data_variable_name
            if data_variable_name in y_lookup:
                y_axis_name = data_variable_name

        ## Plot
        ax = axs.flatten()[index_scan_id]
        ax.set_title(("Scan ID = " + str(scan_id) + subplot_title_labels[index_scan_id]), color=(0, 0, 0, 1), fontname="Calibri", size=12)
        ax.plot(scan_raw["primary"]["data"][x_axis_name].read(), scan_raw["primary"]["data"][y_axis_name].read(), label="", marker=".", markersize=0, color=(0, 0, 0, 1), linestyle="solid")
        ax.axvline(maxima[index_scan_id], color=(0, 0.7, 0, 1), linestyle="dashed")
        ax.set_xlabel(x_axis_name, color=(0, 0, 0, 1), size=12)
        ax.set_ylabel(y_axis_name, color=(0, 0, 0, 1), size=12)

    ## Plot Formatting
    for index_row in np.arange(0, number_rows, 1):
        for index_column in np.arange(0, number_columns, 1):
            ax = axs[index_row, index_column]
            ## Axes scaling and ranges
            ax.set_xscale("linear")
            ax.set_yscale("linear")
            ## Border formatting
            for Border in np.array(["top", "bottom", "left", "right"]):
                ax.spines[Border].set_linewidth(2) ## axes/border linewidths
                ax.spines[Border].set_color((0, 0, 0, 1)) ## axes/border colors
            for Axis in np.array(["x", "y"]): ax.tick_params(axis=Axis,colors=(0, 0, 0, 1), width=2)
    plt.tight_layout() ## Ensures that subplots don't overlap
    plt.show()


view_fiducial_scans(
    scan_id_start = 111007,
    maxima = [3.218824999999981, -2.8042000000000087, 0.7505399999999938, 1.2411399999999944, -2.321355000000011, -187.27430500000003, -2.0051250000000067, 0.10652499999999065, 0.7922649999999933, -1.3923850000000115], ## From automated fiducial scan
)
```